Everest/wmic Sensor Readings
I try to monitor as many of the motherboard sensors as possible, since they often reveal a variety of hidden problems. Unfortunately, there is not a single universal source of motherboard sensor data available, so I have had to write multiple script templates that each pull sensor readings from device-specific sources, and then make them look and feel the same inside Cacti. This specific script template is for the Everest Ultimate system diagnostic toolkit for Windows, as exposed through WMI on the host operating system and read by the wmic utility on the Linux management station.
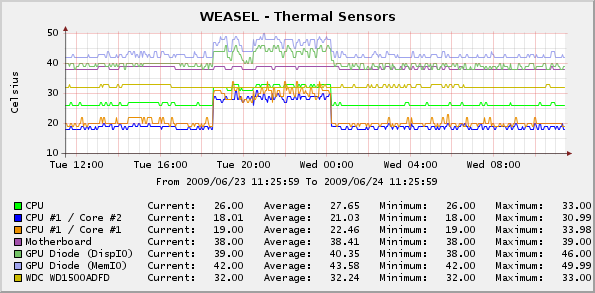
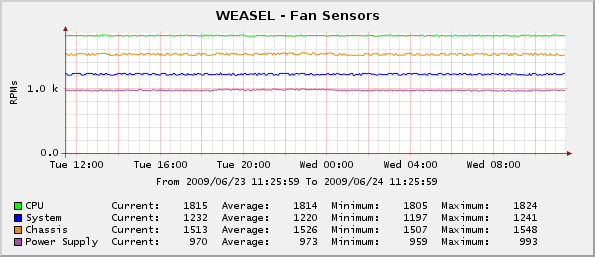
For illustration purposes, the graph in the figure at right shows the thermal sensor readings for a Windows XP workstation with an ASUS P5WDG2 WS-Pro motherboard, a Core2 Duo processor, an ATI HD-4670 video card, and a WD Raptor hard drive (Everest is not limited to motherboard temperatures like many other tools). Additional graphs from that same system show four fan speed sensors and five voltage sensors. I have also successfully used this software to monitor a variety of other platforms, ranging from older Athlon PCs all the way up to multi-CPU Xeon servers.
Everest is able to monitor sensor readings and republish the data in a variety of locations, such as log files, on-screen overlays, and so forth, and this includes WMI. However, Everest does not store the WMI data in the traditional Performance Counter classes in the root/cimv2 namespace but instead uses the application-specific Everest_SensorValues class in the root/wmi namespace, meaning that we cannot use off-the-shelf tools to query for performance-monitor data.
Adding to the complexity is the fact that Cacti on Linux does not offer a predefined way to access raw WMI data, since that requires Windows-specific tools and technologies that are not commonly included with Linux distributions (Cacti on Windows is capable of reading these values directly, however). As such, in order to integrate these sensors into Cacti in a meaningful way, this script template uses the open-source wmic utility provided by the Zenoss management software, which uses Samba to relay the WMI queries to a Windows PC. In this arrangement, we use the Cacti script server interface to call wmic which queries the root/wmi namespace on a Windows PC for the Everest sensor readings, and then return the sampling data to Cacti for graphing.
Installation
To use this script template, perform the following steps:
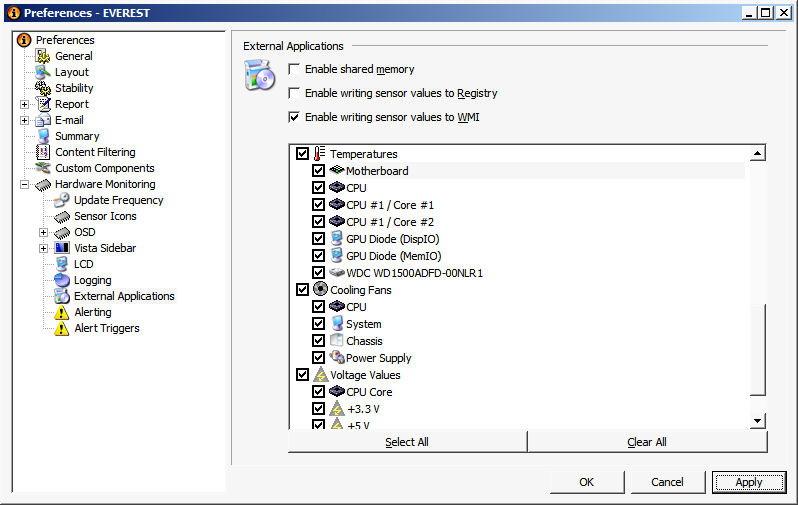
- Download and install Everest Ultimate from the Lavalys web site (note that Everest is commercial software). Open the program's File/Preferences menu, expand the Hardware Monitoring tree, select the External Applications entry, and enable the sensors that you wish to monitor. Note that the script provided here only monitors sensors associated with fans, temperatures and voltages. Also note that the evaluation license of Everest will block some of the sensor readings from being published, meaning they cannot be monitored until a working license is acquired. Also note that Everest provides the ability to automatically start on user login, but it does not provide the ability to run as a service, so if you want to have the software run at all times you will need to use some kind of service wrapper.
- Enable wmic access to the WMI namespace. By default, Windows systems only allow members of the local Administrators group to access WMI data from remote, so you will either need to use an account that is a member of that group or add the necessary access rights to another account. In my case, I use a dummy account that is a member of the Guest group and therefore is unable to login to the network, but is able to access WMI over the network. The minimum set of rights required can be set with the following steps:
- Start the dcomcnfg.exe utility, navigate to the Component Services/Computers/My Computer entry, right click and open the object's Properties dialog, click the COM Security tab, click the Edit Limits button in the Launch and Activation Permissions section, and then add the desired Windows account with the Remote Activation privilege. This allows the user to initiate a WMI process across the network.
- Start the wmimgmt.msc MMC snap-in, select the WMI Control entry, right click and open the object's Properties dialog, select the Security tab, expand the Root control, select the WMI namespace, click the Security button, and then add the desired Windows account with the Remote Enable privilege. This grants the user with remote access privilege to the WMI process.
- Obtain a working copy of the wmic binary,
and store it in a directory with enough permissions where it will be found
when the Cacti poller is executed (note that cron typically
uses a very limited path variable). You may be able to download a pre-made
binary for your Linux distribution from an online package repository, or you
may be able to use one that is included in Zenoss, or in worst case scenarios
you may need to compile the program from source. Verify that the program is
able to read the WMI values on the target systems by issuing test queries
to the desired system with the Windows administrator account, and then test
any restricted-privilege user accounts separately. In the sample below, wmic is
able to successfully query the sensor devices on the "weasel" host with the
username and password of "cacti":
[ root# ] wmic --user=cacti --password=cacti --namespace="root/wmi" //weasel \ "select * from Everest_SensorValues" CLASS: EVEREST_SensorValues ID|Label|Type|Value FPSU|Power Supply|F|964 TCC-1-1|CPU #1 / Core #1|T|19 V5VSB|+5 V Standby|V|5.04 THDD1|WDC WD1500ADFD-00NLR1|T|32 VCPU|CPU Core|V|1.14 VP5V|+5 V|V|5.12 FSYS|System|F|1232 VP12V|+12 V|V|12.36 FCPU|CPU|F|1805 TMOBO|Motherboard|T|38 TCPU|CPU|T|25 TGPU1DIOM|GPU Diode (MemIO)|T|42 FCHA|Chassis|F|1513 TGPU1DIOD|GPU Diode (DispIO)|T|39 V33V|+3.3 V|V|3.33 TCC-1-2|CPU #1 / Core #2|T|18 - Download cacti-everest-wmic.0.4.tar.gz to a temporary directory on the Cacti server machine.
- Expand the archive with the command
tar -xvzf cacti-everest-wmic.tar.gz, and change to the cacti-everest-wmic directory that is created. - Copy scripts/ss_everest_wmic.php to the <cacti>/scripts/ directory.
- Using a text editor of your choice, change the values for wmi_username and wmi_password in the XML files in the resource directory to reflect the credentials for your network, and then copy the resulting files to the <cacti>/resource/script_server/ directory. Note that Cacti does not currently provide a way to associate program-specific variables with a data query, so the WMI authentication credentials have to be stored somewhere they can be read by the script.
- Access the Cacti installation in a web browser, click on the "Import Templates" menu item on the left side of the Console screen, open the templates folder, and import the three data query templates. Cacti should automatically create the required data templates, data input methods, graph templates, and data queries.
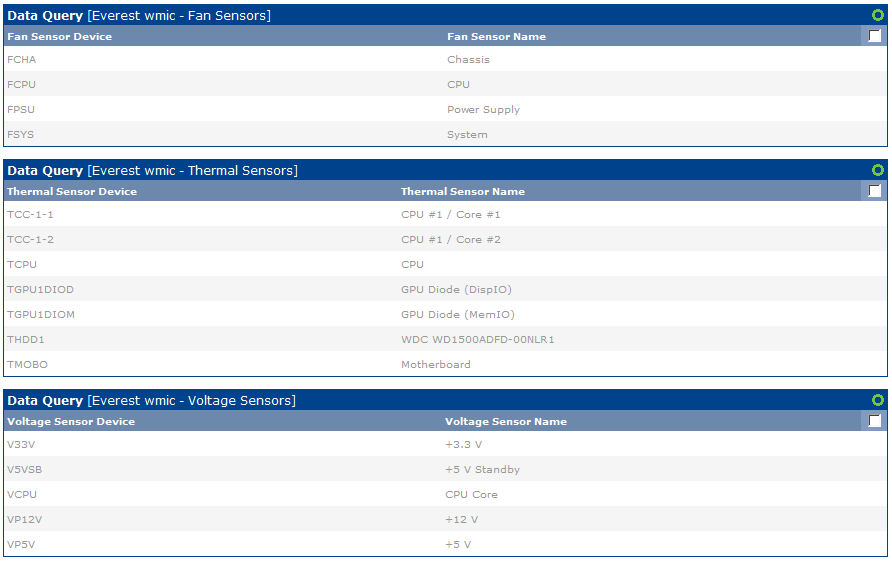
- Click on the "Data Queries" menu item on the left side of the Console screen and verify that an "Everest wmic- Fan Sensors" data query is present. Click the name of the object and verify that Cacti was able to locate and read the XML resource file. Repeat this process for the Thermal and Voltage data queries.
- Click on the Devices menu item on the left side of the Console screen, select a device that is running Everest Ultimate, and scroll down to the "Associated Data Queries" table at the bottom of the screen. Select "Everest wmic - Fan Sensors" in the "Add Data Query" drop-down box, and click the "Add" button. Repeat this step for the Thermal and Voltage data queries.
- After the Device screen reloads, verify that the data queries added in step 7 above are present, and then click the "Create Graphs for this Host" link at the top of the page.
- Once the screen finishes loading, locate the "Everest wmic - Fan Sensors" data query, which should be similar to the figure at right. Select the sensors that you want to monitor, and click the "Create" button at the bottom of the screen to include them in the polling process. Repeat this process for the Thermal and Voltage data queries as desired.
Note that these files are intended to be used with Everest Ultimate v4 and v5, Cacti 0.8.6 and 0.8.7 and PHP 5.2, and may not operate as expected with other versions.
Multi-Sensor Graphs
The process described above will result in each sensor device having its own individual graph. The tarfile includes graph templates that can be used to pull readings from each of the individual data sources into a single graph, although some editing is required. To use these graph templates, perform the following steps:
- Access the Cacti installation in a web browser, click on the "Import Templates" menu item on the left side of the Console screen, open the templates folder, and import the three "8x" graph templates. If you encounter the error "(GPRINT Preset) Exact Numbers" during the import process, you will need to take the following corrective action:
- If you are running an older version of Cacti 0.8.6, you may need to create the Exact Numbers GPRINT manually. To do so, click on the Graph Management menu item on the left side of the Console screen, and then click on the GPRINT Presets sub-menu item. Create a GPRINT Preset with the name of "Exact Numbers" and the Text value of "%8.0lf". After the GPRINT has been created, you can try to import the 8x graph templates again.
- Sometimes the graph items can become disassociated from the data source placeholders during the import process. To investigate if this is the problem, click on the "Graph Templates" menu item on the left side of the Console screen, open the 8x templates that caused the error to be reported, scroll down to the "Graph Item Inputs" section, and click on the top entry. The screen should reload with all of the graph items enumerated, and the top five graph items should have their selection boxes enabled (thereby indicating that they are associated with this entry). If the selection boxes for the top five items are not enabled, manually enable them and save the changes. Repeat this process for all of the graph items to ensure that all of the graph items are correctly associated with a data source.
- If you have exactly eight sensors of a specific type, you do not need to edit the associated graph template. However, if you have less than eight sensors of a specific type, you will need to create a copy of the associated graph template that refers to the exact number of sensors available. Similarly, if you have more than eight sensors of a specific type, you will need to spread them across two or more consolidated graphs, and would need to create copies of the associated graph template that contain the necessary number of data sources that total the cumulative number of sensors available. To create copies of the graph template(s), click the "Graph Templates" menu item on the left side of the Console screen. For each copy, select the appropriate 8x graph template in the list, choose "Duplicate" in the drop-down list at the bottom of the screen, and then click the "Go" button. You will then need to edit each copy, delete any individual graph items that reference unused data sources, and assign a new name to the graph template.
- Once the appropriate-sized graph templates have been created, click the "Graph Management" menu item on the left side of the Console screen. Once the resulting screen finishes loading, click the "Add" button in the upper right corner to create a new consolidated graph.
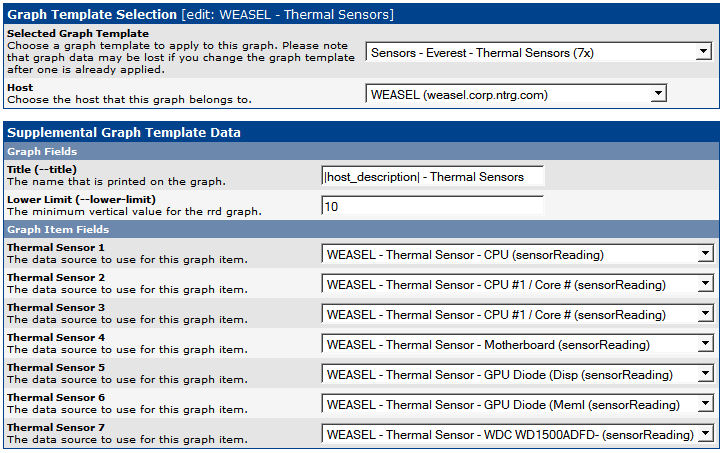
- Locate the appropriate graph template from the "Selected Graph Template" drop-down list, then choose the target device from the "Host" drop-down list, and then click the "Create" button to proceed.
- In the resulting screen, you will be presented with a list of the data source entries in the graph template, and given the opportunity to match each data source entry with a data source from the device. Each of the device-specific data sources were created when the individual sensors were selected for monitoring, so each sensor that is currently being monitored has its own discrete data source that can be incorporated into the consolidated graph. Choose the data sources that you would like to incorporate, and then click the "Save" button when finished.
- After the graph has been created, click on the "Graph Management" menu item on the left side of the Console screen, and verify that the graph you have just created is shown in the list. If you would like to use only the consolidated graph, you may also delete the individual sensor-specific graphs from this screen. If you do this, however, do not delete the data sources associated with the individual graphs, as those will still be needed for the consolidated graph.
Script Input and Output
In some cases you may want to execute the script file manually for debugging purposes. The parameters to the script use a fixed structure that is optimized for use with the Cacti poller, but also allows for human interaction. In particular, the script uses three parameter groups, with the exact structure depending on the output that is desired.
The first parameter group provides a WMI protocol "bundle" of the following values, separated by colon characters: In those cases where a value is unneeded (such as a null password), the value can be omitted.
- hostname: The domain name or IP address of the target device. This value is mandatory.
- wmi username: Part of the credentials for WMI queries. wmic requires a username to be specified.
- wmi password : Part of the credentials for WMI queries. A null password can be specified by leaving this field empty.
Taken as a whole, a valid WMI bundle for the "w2k3" device with the username and password of "cacti" would be "w2k3:cacti:cacti".
The next parameter identifies the sensor type for the queries. The sensor type must be specified as either "fan", "temperature" or "voltage". The sensor type is needed in order to locate the correct data, and is also used to normalize some types of response strings, and as such must always be specified.
The next parameter identifies the type of Cacti data that is being requested. Cacti uses "index" queries to enumerate all of the entries for a data query template, and then uses various kinds of "query" queries to obtain extended information about those entries (such as the full name of each indexed entry). Separately, the Cacti poller uses "get" queries to fetch the readings for each specific entry (again, keyed by index value). Note that he index and query operations are typically only performed when the device entry is being created or modified, and the get operations provide the actual readings to the poller. This script parameter must be one of those query types, with any remaining parameters providing any necessary supplemental data. Specifically the request parameters are one of the following:
- index: This request asks for a list of sensor device identifiers. No additional input data is needed. The response data is provided as a series of index values, with each sensor being enumerated on a separate response line.
- query <fieldname>: This request asks for the specified field data associated with each sensor device. The response data is provided as "index:data" pairs, where the index value is the primary device identifier, and the data value is the requested field data as available.
- get <fieldname> <sensor>: This request asks for the specified field data associated with the specified sensor device. The requested data is provided by itself with no other accompanying information.
The field names that can be used in "query" or "get" requests are as follows:
- sensordevice: The index value for the sensor(s).
- sensorname: The human-friendly name for the sensor(s).
- sensorreading: The current reading for the sensor(s). For example, "12" volts, or "2300" RPMs.
You must know the index value that has been assigned to a device before you can ask for details about that specific device. To do this, y ou can use the "query sensorname" request to get a list of sensors and their descriptions, and then use the "get <fieldname> <sensor>" request to get information about the desired sensor. The full command lines for these requests, using example data from above, are shown below:
$ php ss_everest_wmic.php hostname:cacti:cacti voltage query sensorname
V5VSB:+5 V Standby
VCPU:CPU Core
VP5V:+5 V
VP12V:+12 V
V33V:+3.3 V

$ php ss_everest_wmic.php hostname:cacti:cacti voltage get sensorreading VCPU
1.14

Copyright © 2010-2017 Eric A. Hall.