Motherboard Monitor/SNMP-Informant Sensor Readings
I try to monitor as many of the motherboard sensors as possible, since they often reveal a variety of hidden problems. Unfortunately, there is not a single universal source of motherboard sensor data available, so I have had to write multiple script templates that each pull sensor readings from device-specific sources, and then make them look and feel the same inside Cacti. This specific script template is for reading sensor data from the Motherboard Monitor 5 utility, as exposed through the SNMP Informant agent.
WARNING: MBM5 is abandonware, is not being developed any further, and does not support the sensor chips that are used on most modern motherboards. It probably will not work on anything except older systems.
Specifically, Motherboard Monitor was designed to read a variety of common sensor chips and then make the data available to other tools through local APIs. One such tool is the SNMP Informant-MBM freeware package, which is an extension agent for the Win32 SNMP agent that queries MBM5 for sensor data and republishes the readings in SNMP. Sensors are stored in a single shared SNMP table, with each sensor having a "type" code that indicates the kind of sensor it represents (ie, a Fan, or a temperature probe, or a voltage sensor). However, if you rename or otherwise shuffle sensors around, you will need to restart the SNMP subsystem on the target, and then refresh the query results to ensure that the correct sensors are being mapped to the proper index values.
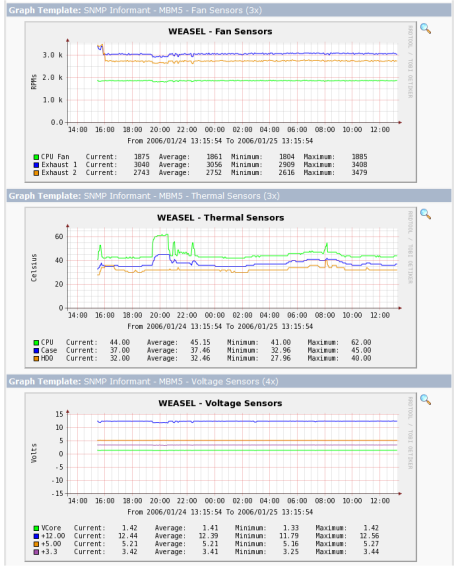
For illustration purposes, the graphs in the figure below show the output from an older P4 workstation. In that example, the motherboard is exporting three fan sensors, three temperature sensors, and four voltage sensors.
Installation
To use this script template, perform the following steps:- Obtain a working copy of Motherboard Monitor 5. The software does not have an official home on the web, so you may have to look on old software repositories or download sites.
- Obtain a copy of the SNMP-Informant MBM5 agent extension and install it per the instructions. Verify that the agent is able to display MBM5 sensor data by using the snmpwalk utility to list all of the MIBs under the 1.3.6.1.4.1.9600.1.10 branch on the target device.
- Download cacti-snmp-informant-mbm5.tar.gz to a temporary directory on the Cacti server machine.
- Expand the archive with the command
tar -xvzf cacti-snmp-informant-mbm5.tar.gz, and change to the cacti-snmp-informant-mbm5 directory that is created. - Copy scripts/snmp-informant_mbm5.php to the <cacti>/scripts/ directory.
- If the server is running Cacti 0.8.6, copy the XML files in resource/0.8.6/ to the <cacti>/resource/script_queries/ directory, or if the server is running Cacti 0.8.7, copy the XML files in resource/0.8.7/ to the <cacti>/resource/script_queries/ directory.
- Access the Cacti installation in a web browser, click on the "Import Templates" menu item on the left side of the Console screen, open the templates folder, and import the three data query templates. Cacti should automatically create the required data templates, data input methods, graph templates, and data queries.
- Click on the "Data Queries" menu item on the left side of the Console screen and verify that a "SNMP Informant - MBM5 - Fan Sensors" data query is present. Click the name of the object and verify that Cacti was able to locate and read the XML resource file. Repeat this process for the Thermal and Voltage data queries.
- Click on the Devices menu item on the left side of the Console screen, select a device that is running Motherboard SNMP Informant MBM5 extension, and scroll down to the "Associated Data Queries" table at the bottom of the screen. Select "SNMP Informant - MBM5 - Fan Sensors" in the "Add Data Query" drop-down box, and click the "Add" button. Repeat this step for the Thermal and Voltage data queries.
- After the Device screen reloads, verify that the data queries added in step 7 above are present, and then click the "Create Graphs for this Host" link at the top of the page.
- Once the screen finishes loading, locate the "SNMP Informant - MBM5 - Fan Sensors" data query. Select the sensors that you want to monitor, and click the "Create" button at the bottom of the screen to include them in the polling process. Repeat this process for the Thermal and Voltage data queries as desired.
Note that the above process will result in each sensor device having its own graph. If you would like to consolidate multiple sensors of a specific type into a single graph, the script template includes graph templates that can be used to pull readings from each of the individual data sources simultaneously, although some editing will likely be required. For example, the figure above shows graphs from five fan sensors, two thermal sensors, and five voltage sensors. To use these graph templates, perform the following steps:
- Access the Cacti installation in a web browser, click on the "Import Templates" menu item on the left side of the Console screen, open the templates folder, and import the three "8x" graph templates. Cacti should automatically create the graph templates. NOTE: If you encounter the error "(GPRINT Preset) Exact Numbers", you may need to create the GPRINT Preset manually before importing the templates. To do so, click on the Graph Management cacti menu item, and then click on the (new) GPRINT Presets sub-menu underneath. Create a GPRINT Preset with the exact name of "Exact Numbers" and the GPRINT Text value of "%8.0lf". That should allow the graph templates to be imported successfully.
- In some cases, graph items can become disassociated from the data source placeholders when the template is imported. In order to prevent problems that can arise as a result of this issue, verify that the graph templates have been imported successfully. Click on the "Graph Templates" menu item on the left side of the Console screen, open one of the 8x templates that was imported, scroll down to the "Graph Item Inputs" section, and click on the top entry. The screen should reload, with all of the graph items being enumerated, and the top five graph items having their selection boxes enabled (thereby indicating that they are associated with this entry). If the selection boxes for the top five items are not enabled, you must manually enable them and save the changes. Verify that all of the graph items are actively associated with each graph item input entry, where each input will provide a data source for each row of data on the graph.
- If you have exactly eight sensors of a specific type, you do not need to edit the associated graph template. However, if you have less than eight sensors of a specific type, you will need to create a copy of the associated graph template that refers to the exact number of sensors available. Similarly, if you have more than eight sensors of a specfic type, you will need to spread them across two or more consolidated graphs, and would need to create copies of the associated graph template that contain the necessary number of data sources that total the cumulative number of sensors available. To create copies of the graph template(s), click the "Graph Templates" menu item on the left side of the Console screen. For each copy, select the appropriate 8x graph template in the list, choose "Duplicate" in the drop-down list at the bottom of the screen, and then click the "Go" button. You will then need to edit each copy, delete any individual graph items that reference unused data sources, and assign a new name to the graph template.
- Once the appropriate-sized graph templates have been created, click the "Graph Management" menu item on the left side of the Console screen. Once the resulting screen finishes loading, click the "Add" button in the upper right corner to create a new consolidated graph.
- Locate the appropriate graph template from the "Selected Graph Template" drop-down list, then choose the target device from the "Host" drop-down list, and then click the "Create" button to proceed.
- In the resulting screen, you will be presented with a list of the data source entries in the graph template, and given the opportunity to match each data source entry with a data source from the device. Each of the device-specific data sources were created when the individual sensors were selected for monitoring, so each sensor that is currently being monitored has its own discrete data source that can be incorporated into the consolidated graph. Choose the data sources that you would like to incorporate, and then click the "Save" button when finished.
- After the graph has been created, click on the "Graph Management" menu item on the left side of the Console screen, and verify that the graph you have just created is shown in the list. If you would like to use only the consolidated graph, you may also delete the individual sensor-specific graphs from this screen. If you do this, however, do not delete the data sources associated with the individual graphs, as those will still be needed for the consolidated graph.
Note: these files are intended to be used with Cacti 0.8.6 and 0.8.7 and PHP 5.2, and may not operate as expected with other versions.

Copyright © 2010-2017 Eric A. Hall.